I hesitate to start a topic on computing the elastic energy for the typical bendform deflections we get in casting since it may reinforce the “big spring” concept that so many people have about the rod’s role in producing line speed. However, as discussed in the spring vs. lever thread it does have some application in a clamped bow and arrow cast where the rod does act like a spring. In that case the amount of PE in the rod will determine how much energy can be converted into the KE of a lure or line as the rod unloads.
In the spring vs lever thread Alejandro noted that computing the PE in the rod with the standard PE=.5*k*x^2 spring energy equation gave values that were much smaller than the value you would get based on the material limit for graphite rods.
You should to take in consideration the energy of deformation for unit of volume not with a load of 50% of the longitude of the rod (for me this form of measuring the flexion doesn't make any sense), but in the limit of proportionality of the material, or at least near that limit.
Merlin had the expertise to compute the nominal elastic energy limit per unit volume (or mass) of a graphite tube near the proportionality (or strain) limit of 1% that is below the nominal strain fracture limit of 2% for graphite and found:
I measured the non-linear force vs deflection curve for just the tip sections of a TCR 8wt rod and found it was equal to f=2.24*x+4.47*x.^3. For a deflection of .6 m that gives a PE value of PE=.5*2.24*.6^2 + .25*4.47*.6^4= .55 J. That compares to the PE Merlin found for the material limit of 1.9J/g*12.5g (the measured mass of the tips)=23.75 J.
That is a huge difference and made me wonder about the validity of using the PE=.5*k1*x.^2 + .25*k3*x.^4 equation for estimating the stored energy in a bent rod. Is that difference due to the “impossibility” of achieving the material limit value, or is the spring energy equation missing something?
The goal of this thread will try to resolve that question. Is the estimate for the PE in a rod given by its measured spring constant values commensurate with the values you get by computing the energy from classical beam theory or not?
I hope that Merlin and Alejandro can add to some of the observations I have made, and will fill in some details of the material science concepts that I am just beginning to scratch.
Gordy
"Flyfishing: 200 years of tradition unencumbered by progress." Ralph Cutter
For a deflection of .6 m that gives a PE value of PE=.5*2.24*.6^2 + .25*4.47*.6^4= .55 J. That compares to the PE Merlin found for the material limit of 1.9J/g*12.5g (the measured mass of the tips)=23.75 J.
Could you expand on what material limit means? Just before failure?
Not sure if this bears on the issue but talking to Daiwa about hoop strength they factor in ovaling in long match poles. According to them the rod ovals under stress and helps cushion sudden lunges when playing a fish and factors into how a pole feels (carp pole fitted with elastic, no reel or line.)
I always think that experimental results are more important than theoretical ones, and did a test using the tip sections of a TCR rod to launch a lure, similar to what Alejandro had done with one of his “ballesta” rods.
From that experiment it appeared that the stored energy was in the ball park of .55 J not 20 J. That result gives some validity to the spring energy equation giving the correct energy value, but it would be reassuring (for me anyway) to come up a comparable value using simple beam theory.
Here is Alejandro's observation on what needs to be done to come up with PE value based on the material properties:
Is it possible to find a mathematical solution? Perhaps, if we know the elastic modules, the elastic limits and the moment of inertia of each section of the blank, and we keep in mind how the flexion is transmitted from the tracts previous to the later, we can find for a certain force which it is the application angle that achieves the maximum deformation possible.
In order to see how the PE value derived from the non-linear spring constant and deflection value compares to the value based on the material properties of graphite, you need to know the effective modulus and geometry of a rod to get the E (Young's modulus) and I (area moment not the MOI) variations along the length of the rod that are critical to predicting how the rod will bend for some applied tip force.
Fortunately Dr. Graig Spolek sectioned some rod blanks to get that detailed information for some of his technical papers , and was generous enough to share that measured data with me.
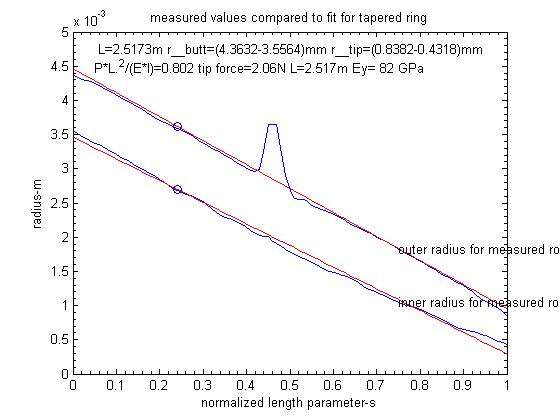
From his rod section data he found most blanks from that era had nominally linear tapers as shown below. This particular example for a Loomis 6wt rod was found to have an outer radius of 4.4 mm at the butt and .84 mm at the tip. Its Young’s modulus was found to be 10.98e06 psi or 82 GPa.
You can see this rod had an (inner radius/outer radius).^2 ratio of .66 at the butt and (.017/.033).^2=.265 at the tip. Applying these radius ratios to Merlin’s equation you can see the J/g value near the butt would be 1.0 J/g and .8 J/g at the tip. Thus the J/g values for this particular rod were smaller than the 1.9 J/g value he calculated in his example, but would still predict much larger material elastic energy limit as compared to the the Loomis rod’s measured spring constant value.
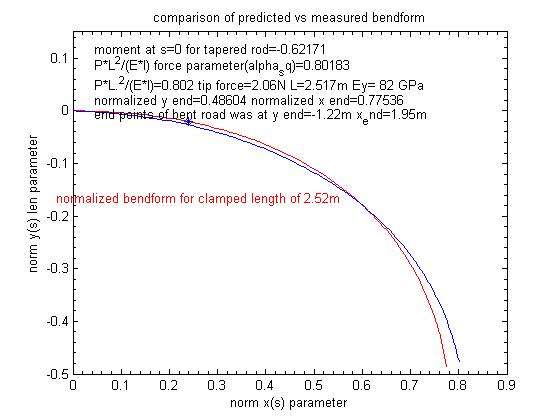
Dr. Spolek also made detailed measurements of the bendform of those blanks prior to cutting them up that can be compared to the shape predicted with simple Euler-Bournoulli beam theory as shown below
It is customary to normalize the length of the beam to unity to get more universal comparisons so the above curves have been scaled by the clamped length of 2.517 m he used in his deflection tests. You can see that the expected variations derived from the tapered ring calculation (the red curve) was very close to measured shape (the blue curve). The tapered ring does not have the small stiffening effect that comes from the ferrule, so it shows a maximum y deflection of -1.22 m vs the measured value of -1.20 m.
To compute the total PE for that bendform from the material properties of the rod, you need to integrate the incremental strain energy variations in the curved beam
Function over the length of the rod as discussed here.
The normalized bending moment along the rod falls out of the beam analysis and the Young’s modulus and the area moment variation along the length of the rod can be easily calculated from Dr. Spolek’s detailed section measurements.
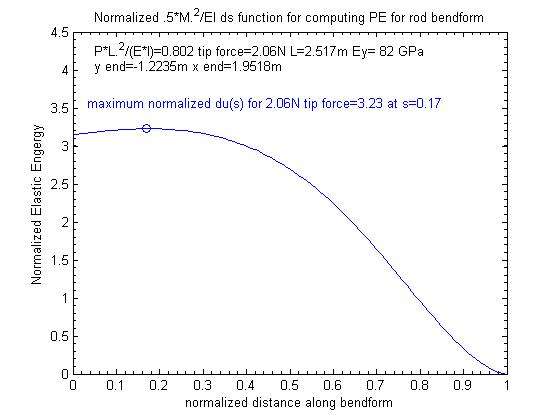
Here is the resulting normalized .5*M^2/EI vs S curve for the bendform shown above for a 2.06N perpendicular tip load on that Loomis blank.
From this curve you can see that most of the incremental PE in the rod was centered around the larger butt diameters with the peak about 1/5 of the way down the blank. It should be noted that the energy density values shown in this plot are scaled by a clamped_length.^2 factor due to the normalization process. Thus the actual peak energy density would be 3.23/6.33=.51 J/m for this rod.
Integrating that du(s) response over the normalized length of the beam and then scaling it by the length of the beam you get this integrated (total) PE response vs. the distance down the bendform.
That shows that the total PE in the rod for that tip load and pull angle was .875 J based on its measured taper and Young’s modulus. As you can see from the slope of this plot, most of the PE in the rod for this pull angle (90 degrees) is coming from the lower half of the rod.
How does that value compares to the PE derived from the PE=.5*k1*x^2+.25*k3*x^4 estimate for the standard spring energy equation?
I am betting it will be close. The spring constant equation is based on the force applied over distance work energy concept, and that is a tried and true approach for computing accurate energy values.
Gordy
"Flyfishing: 200 years of tradition unencumbered by progress." Ralph Cutter
How does the PE value based on analyzing the bendform of the rod compare to the one from the PE=.5*k1*x^2+.25*k3*x^4 estimate for the standard spring energy equation? I am betting it will be close.
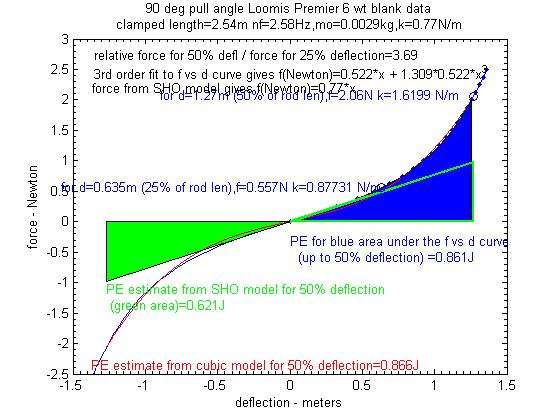
Here is a plot of the PE that you get with the PE=.5*k1*x^2+.25*k3*x^4 estimate based on a cubic fit to the force vs deflection curve for the Loomis rod.
The area under the force vs deflection curve for that rod was equal to .861 J (the blue area). That area was calculated using numeric integration techniques. The energy from the spring equation was slightly larger at .866 J as noted in the red comment on the plot, but gave the same nominal value.
This rod had a large cubic term (k3=.683) relative to the first order term (k1=.522) so its slope for small deflection was quite small and then quickly crossed over the curve based on the frequency vs. tip load k value (k= .77) for deflections larger than 20% of the rod length. That makes a big difference in the PE expected in the rod for the large 50% relative deflection value shown in this plot.
The area under the k=.77 spring constant (green area) derived from the SHO model, was only .621 J so you can see that the effect of the non-linear cubic spring constant term can be significant for larger deflections. The same would hold true for the force that would be expected for large deflections as well.
However, you can see these values are very close to that computed with simple beam theory (.875 J), so I do not think Merlin and Grunde need to change the way they compute the PE in the rod using the standard spring energy equation.
Gordy
"Flyfishing: 200 years of tradition unencumbered by progress." Ralph Cutter
All data and equations derive from the Euler Bernouilli equations, and you should find that whether you integrate the PE as you did for the Loomis rod or whether you use a variable stiffness fit to integrate also the work of a progressive load, the figures are close together (I already checked that with my models).
You cannot rely on my general estimate for 1% stretch all along the rod because the real stretch varies along the shaft. This figure was just an example to illustrate what Alejandro was saying: a rather big amount of PE is theoritically possible.
In practice, you can reach 1% in some place for a very large deflection, and the risk for the rod is not linked to the maximum stretch capability of graphite fibers (1.8% to 2%) but to the ovalisation of the sections. They can collapse even below 1% dependind on the design.
Merlin
Fly rods are like women, they wont´play if they're maltreated.
Charles Ritz, A Flyfisher's Life
you should find that whether you integrate the PE as you did for the Loomis rod or whether you use a variable stiffness fit to integrate also the work of a progressive load, the figures are close together (I already checked that with my models).
Merlin,
I hope you have a great trip, and will not expect to get a response to this until you return home.
I think my results show the same thing and using the spring equation is a much easier way to get a reasonably accurate value. Do you think that it does make sense to calculate the PE using the PE=.5*k1*x^2+.25*k3*x^4 model as long as the k factors are associated with the direction of the pull angle?
It appears to me that the bendform shapes we get in casting produces PE values that are no where near the material limit values. Do you see the same thing in your measurements?
Do you have any data on how the spring constant varies with pull angle? That will involve a combination of spring constant values for the tangential as well as perpendicular deflection distances, but is easy to measure the deflection in the direction of the pull just by angling the rod and then measuring the deflection in the y-direction vs a vertically directed force produced by hanging different masses from the tip.
I will crunch some measured data using that approach (for a rod tilt angle of 45 degrees) and post the results later in the week.
and the risk for the rod is not linked to the maximum stretch capability of graphite fibers (1.8% to 2%) but to the ovalizing of the sections. They can collapse even below 1% depending on the design.
Do you have a copy of the Ohnishi and Matsusaki paper? They show the buckling limit for one of their designs was around .6-.7%. I am wondering if that is the failure mechanism for guys like Paul who can break a rod by casting?
When I see Tim Rajeff needing a forklift to break a 10 wt rod it makes me wonder how you could ever produce that kind of bending strain by casting. Even a three weight is not easy to break as shown below.
Gordy
"Flyfishing: 200 years of tradition unencumbered by progress." Ralph Cutter
I will crunch some measured data using that approach (for a rod tilt angle of 45 degrees) and post the results later in the week.
We know that the rod bends less for forces applied in the tangential direction as compared to normal forces, but I have not been able to find anything that quantifies the difference. One angle does not tell the whole story, but it is a place to start. Thus this post will show how the rod reacts to forces that are applied 45 degrees to the orientation of the butt.
To do this I just angled the rod 135 degrees and then did the conventional pennies in a bag deflection test to see how the tip path of the rod varied for different loads. In this configuration the force is applied in the vertical direction so the difference in the y position of the tip vs the tip force will give the force vs deflection data you need to measure the spring constant in that 45 degree direction.
By measuring the x position along with the y direction you can calculate the equivalent force vs. deflection values for the normal and tangential spring constant values as well. That will show how much stiffer the rod is in the axial direction.
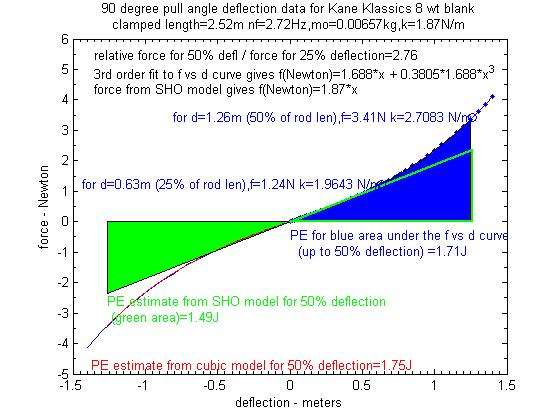
As a reference here is the force vs deflection curve that we normally use for determining the rod spring constant for a 90 degree pull angle with the rod clamped in a horizontal position. The blank is for a Kane Klassic saltwater rod that was labeled as an 8wt. You can see that in this orientation the force vs deflection curve was more linear than most and had a relative cubic stiffening term that was only .38 times the linear k1 term of 1.69 N/m.
As noted in the sub-title on the plot the parameters found for this rod from its SHO measurement were natural frequency=2. 72 Hz, k=1.87 N/m, and mo=6.5 g. As is normally the case the k value derived from the SHO model is a bit larger than the k1 linear value found from the direct measurement. Those two values are about the same for deflections around 20% of the cantilevered length which is the nominal amplitude used in the loaded frequency measurements.
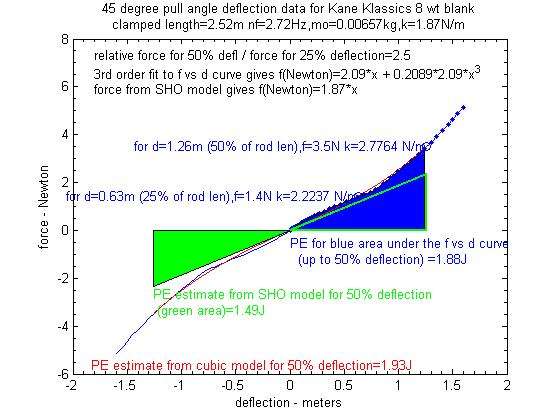
Here is force vs. deflection curve for the 45 degree pull angle where the deflection vector is in the same direction as the pull angle. The integral of that curve (the blue area) up to a 50% deflection of 1.26m gave a PE estimate of 1.88 J.
You can see the linear term for the non-linear spring constant in that direction (k1=2.09) was about 20% larger than the value for a 90 degree pull angle (k1=1.69). Because the rod is relatively stiffer for 45 degrees pulls it does not deflect as much. The energy depends on the squared of that deflection, and consequently the PE at the 50% deflection distance was about 10% larger (1.88J vs 1.71 J for the 90 degree case).
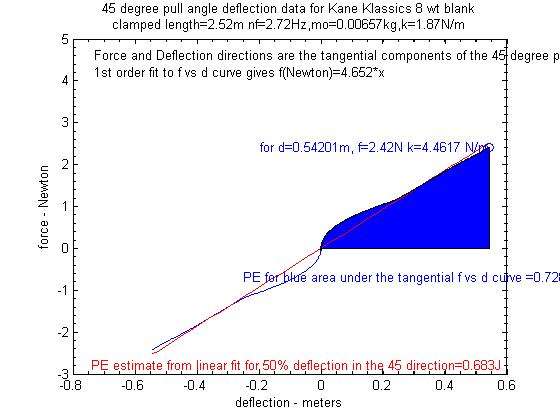
That 45 degree k value is larger because the 45 degree pull angle brings into play the axial (tangential) stiffness of the rod in addition to the stiffness in the normal direction. Here is the force vs deflection curve based on the component of that force in the axial direction and the projected deflection along that tangential axis.
That curve has a very high force vs deflection slope for small deflections and then settled into a more linear response for tangential deflections 10% larger than the length of the rod. Because the rod is stiffer in the axial direction (k1=4.62) its deflection is rather small for this range of forces. As a result the PE in the rod at the point the deflection in the 45 degree pull direction was 50% of the rod length was only .72 J as shown for the blue area above.
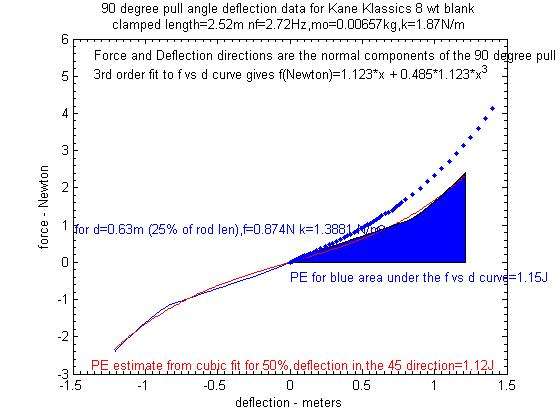
The remaining PE energy came from the components of the 45 degree pulling force that were perpendicular (normal) to the rod butt. That curve is show below along with the measured points for the force vs deflection found for a direct pull angle of 90 degrees shown for the dotted blue points on this graph.
Because there is some resistance to bending coming from the axial stiffness the k1 term for this curve is smaller (k1=1.12) than the corresponding k1=1.69 linear term found for the direct pull angle of 90 degrees. The PE component in the normal direction at the 50% deflection point in the direction of the pull was 1.15 J. When that value is added to the .72 J PE component from the axial stiffness you get the total PE in the rod of 1.87 J that was found for the measured curve in the direction of the 45 degree pull angle.
Thus even though the rod is stiffer in the axial direction about 60% of the total PE in the rod comes from the larger deflection distances you get in the normal direction. That relationship would no doubt switch for smaller pull angles when the deflection in the axial direction would be larger than the deflection in the normal direction.
I hope that Sakke can add some additional pull angle data to this, as it would be interesting to see how much PE came from the tangential component in a bow and arrow cast made by pulling back in the direction of the butt as is done with the ballesta technique for casting a lure.
Gordy
"Flyfishing: 200 years of tradition unencumbered by progress." Ralph Cutter
Since the PE we get for the bendforms we observe in casting is so much smaller than the material limit value I wondered how the rod would need to be bent to achieve the bending curvature radii that would produce a 1% strain in all the sections of the rod from the butt to the tip.
The maximum strain in curved section of a tubular beam is equal to r_outside/(radius of curvature). Thus to get a 1% strain at some point in the rod the radius of curvature at that point would need to be 100 times larger than the outside radius of the rod’s cross-section. For this Loomis rod that means the radius of curvature would be .446 m at the butt and .0307 meters at the tip. As noted by Alejandro that would require the rod to have a spiral bendform as shown below.
The normalized energy density as a function of the normalized length down the bendform for the uniform 1% strain limit is shown below.
For the uniform strain case, the energy density scales by the I(s) area moment variations. Thus the maximum density occurs at the butt of the rod (s=0) where the area moment is at a maximum. Because of the scaling to get a unity length for the bendform, the normalized energy density in this curve would be divided by the square of the clamped length (factor of 6.33 for this case) to get the actual J/m density value.
I don’t know how you could actually apply the bending moments along the length of the rod to get that shape (maybe wrap it around a spiral track) or if the rod would suffer a hoop strength failure before you actually achieved it. But if you could, the resulting PE for the taper in this rod design was calculated to be a whopping 49 Joules. The mass of this blank was 48.5 g which results in an average material limit energy value of 1.0 J/g. This compares to Merlin’s estimate of 1.0 j/g at the butt and .8 J/g at the tip.
Thus as Merlin predicted, the theoretical PE you could expect for the material strain limit would be orders of magnitude greater than what is actually produced for the deflected shapes we can produce in casting. As he noted bending the rod into the required coiled shape of a watch spring is “just impossible.”
Thus from an academic standpoint the theoretical PE that could be stored in the rod based on its material limit is tremendous, especially in the large diameter sections of the rod. However the actual PE stored in the rod for the bendforms we actually produce in casting is much, much smaller. As a result I don’t think you are going to see 20 meter bow and arrow casts where the only energy source was the PE in the rod. There is just not enough PE in the rod to produce the line speed required for those kind of distances.
Gordy
"Flyfishing: 200 years of tradition unencumbered by progress." Ralph Cutter
In my long arguments with Bill, i said that we could somehow place both stiffness and action of a rod in just such a curve. Coil every rod up and compare them. Too simple maybe?
Paul,
I don't know how you could coil up a rod to get that spiral bendform, (if I understand what you mean) or what it would say about how a rod would cast.
It is straightforward to compute the bending moment required along the length of the rod to get it to bend into a coiled spring in a computer simulation, but I don't know how you could actually do it in practice.
Therefore it does not seem to be simple to me.
Don Phillips shows a more practical way to measure the stiffness profile of a rod in chapter 10 of his book if you have a copy. I am glad I got my copy before it went out of print and started selling for $100 (used) on Amazon.
Gordy
"Flyfishing: 200 years of tradition unencumbered by progress." Ralph Cutter